Inleiding
Vriend en collega Matt Briggs heeft weer fantastisch werk verricht. Nu op het vlak van data analyse van concentraties nitraat en chloride in oppervlaktewater. Hij heeft daarover recentelijk geblogd.
De data analyse is een kritiek op een paper uit 2021 die, uiteraard, landbouw de ‘schuld’ geeft van de aanwezigheid van ’teveel’ stikstof in oppervlaktewater.
Ziehier de ijsschotsen discussie in werking.
Als het politiek op het vlak van atmosferische stikstofdepositie dreigt mis te gaan - AERIUS begint zijn glans glansrijk te verliezen - is er een ’nieuwe’ invalshoek nodig waarmee politiek en media zand in de ogen kan worden gestrooid.
Voilà. Water is een prachtig onderwerp om op een andere wijze landbouw primair te beschouwen als een vervuilende industrie, niet als een voedselproducent!
Enfin. Ik geeft het woord aan vriend Matt (met een enkele wijziging).
(Yet Another) New Paper Proves There Is No Nitrogen “Crisis” In The Netherlands
There is in the Netherlands a concocted “nitrogen crisis”, which has all the earmarks of a manufactured panic. I don’t mean in the conspiratorial sense. I mean in the Expert-created and ruler-desired sense of wild over-certainty, half-assed conclusions, and wholly unnecessary, but badly desired, “solutions” mixed with ridiculous vice-signaling zeal in efforts to fix a problem that doesn’t exist.
Which is to say, business as usual in an Expertocracy.
Now I don’t want your eyes to glaze over or for you to surf away because this is happening in some faraway foreign country. Because it’s also happening here, only with “carbon” instead of “nitrogen.” The same techniques we apply to puncture the balloon of heated over-certainty in the Netherlands can be used here, too.
Those who can read Dutch can see Geesje Rotger’s tweet and magazine article on the subject. Those who want the full details can read our paper (in English) “Nitrogen and Chlorine Changes Through A Netherlands Catchment – A Critique of Kaandorp et al. (2021)“.
What follows here is a brief, and necessarily incomplete, summary of that paper. All quotes below are from our English paper.
We generously received data and code from another paper (Kaandorp, 2021) and reanalyzed it. We discovered there was no problem with “nitrogen”—specifically nitrate (they also measured chlorine and tritium, which don’t matter to us today, but details are in the paper).
Just like with “climate change” and “carbon” people will say “nitrogen”.
There is a beek, or stream, in Springendalse, which is in eastern Netherlands. Nitrate was measured at both upstream and downstream locations, and over time. Kaandorp “reports that upstream ‘has several spring areas and is mostly forested with some agricultural fields’, and that downstream is predominately farmland.”
The “crisis” is that some say the farmland is contributing too much nitrate, which is seen everywhere as bad, like carbon dioxide. The analogy is complete because without either, no life is possible.
We show farms are not contributing too much nitrate.
Nitrate can be present downstream by starting upstream and wending its way down, while avoiding reacting with anything, or it can be injected anywhere along the way, including downstream at the farms. It takes, Kaandorp says, anywhere from 4 to 11 years for water to make its way from up- to downstream. Well, it’s a long way and it’s dark.
Measurements are a problem. There aren’t that many, they are not consistent, and they are not of high quality. From that alone we can conclude there can be no great confidence there is a “crisis.”
Here’s a time series picture marrying all sources:
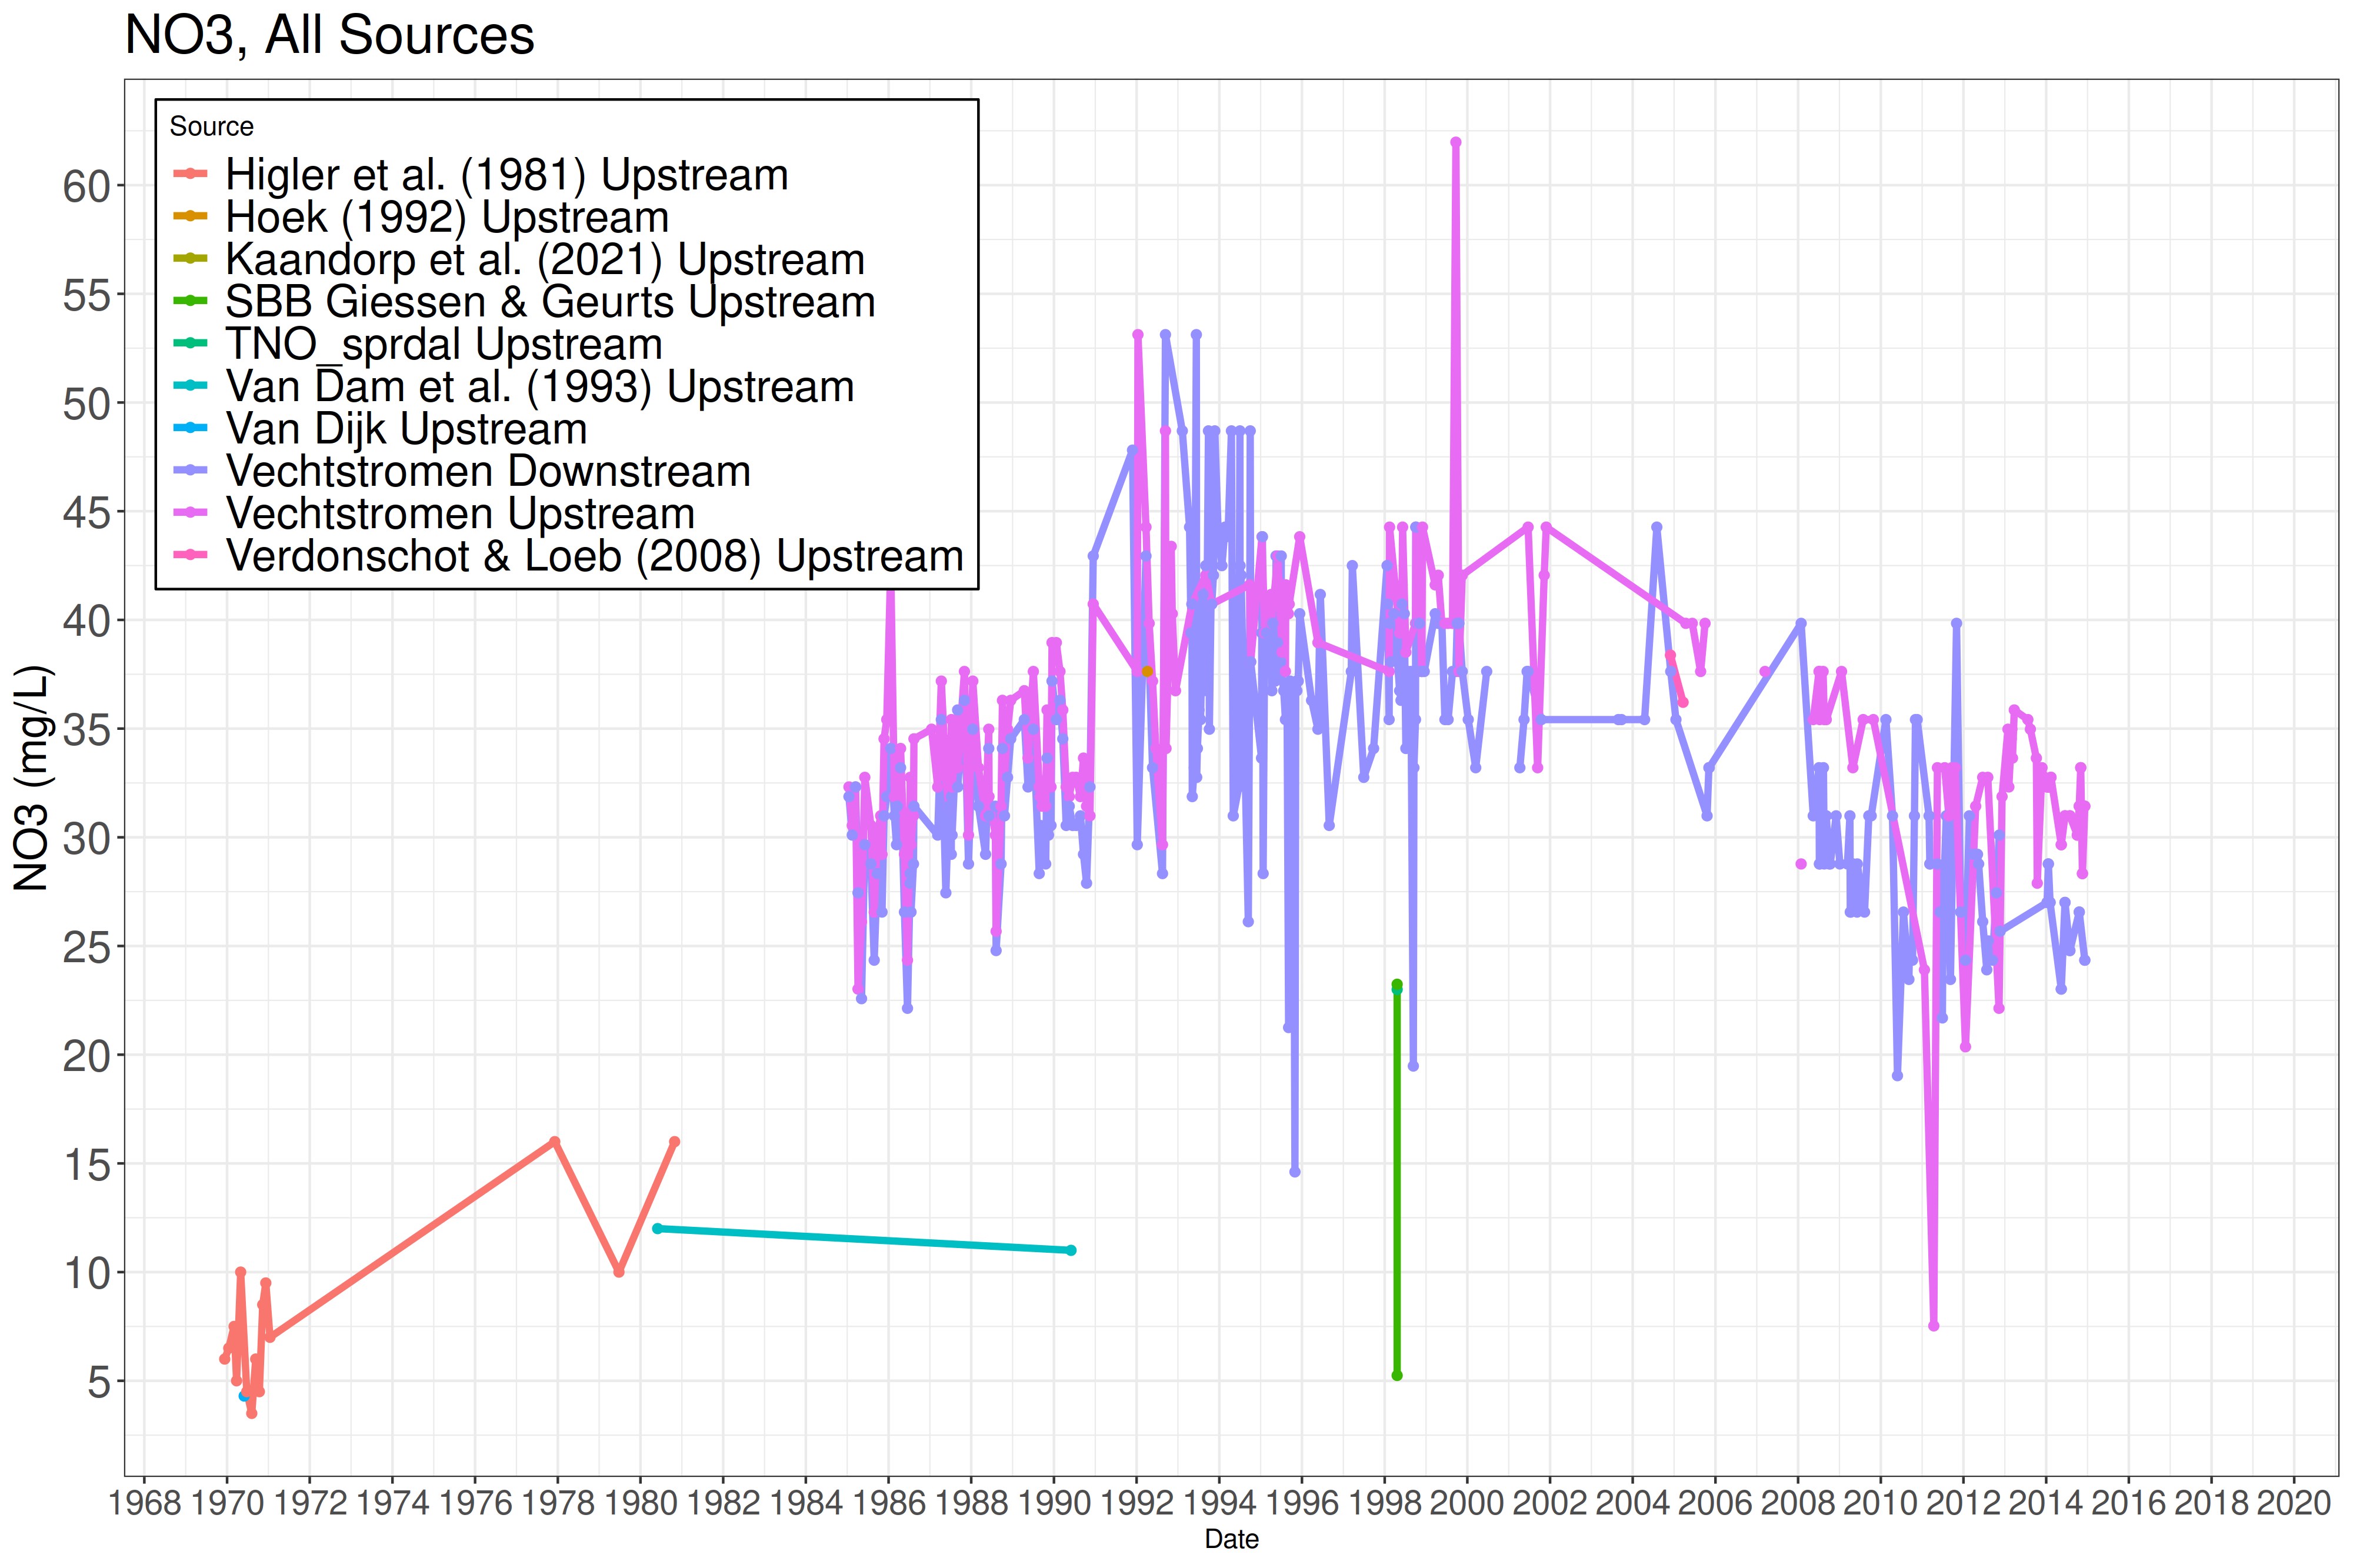
See the green vertical line? That’s one source for upstream measurements. Contrast it with the light purple, which is contemporary but from another source. The two measurements, both of the same times and place, aren’t that close. Yes? Which one is right? I have no idea. And neither does anybody else.
The orange and light blue are also oddly different than the others. Are they the correct ones? Who knows?
To maintain some kind of consistency, and because we have no idea how to combine disparate sources, we used just the Vechtstromen Water Board data, which at least had more-or-less simultaneous up- and downstream measures, and over a long period of time. If there’s any bias there, for instance the green line being correct, we can’t know it.
Here’s what we did:
Our purpose is to estimate the amount of change from upstream to downstream amounts of NO3…[A]ny number of causes are responsible for changes from the two points…which include runoff, various reactions with the substrate, and from precipitation and other sources, both upstream on through to downstream. These concentrations are changed from up- to downstream via reactions with the soil, air, and stream, and via additions from precipitation, runoff, and so forth.
We say nothing directly about these various causes of additions and subtractions. But it is still of interest to estimate the amount of change that occurs, and its direction. Knowing the amount helps point in the directions of which causes might be most present or absent and on the relative importance of those present. For instance, if more NO3 is found downstream than was found initially upstream, whatever caused these additions could be investigated. Likewise, if less nitrate is found downstream than upstream, the causes of this subtraction are obviously of greater importance than whatever might be causing additions, especially considering most agricultural sites are downstream.
With me so far?
Let’s suppose Kaandorp is right about the median of four years it takes for water to get from up- to downstream (in the paper we also do 0 and 11 years).
Here is a picture of the estimated downstream minus upstream values, assuming a 4-year travel time. If there were more nitrate downstream, where the farms are, the difference would be positive. Is it? No, sir, it is not.
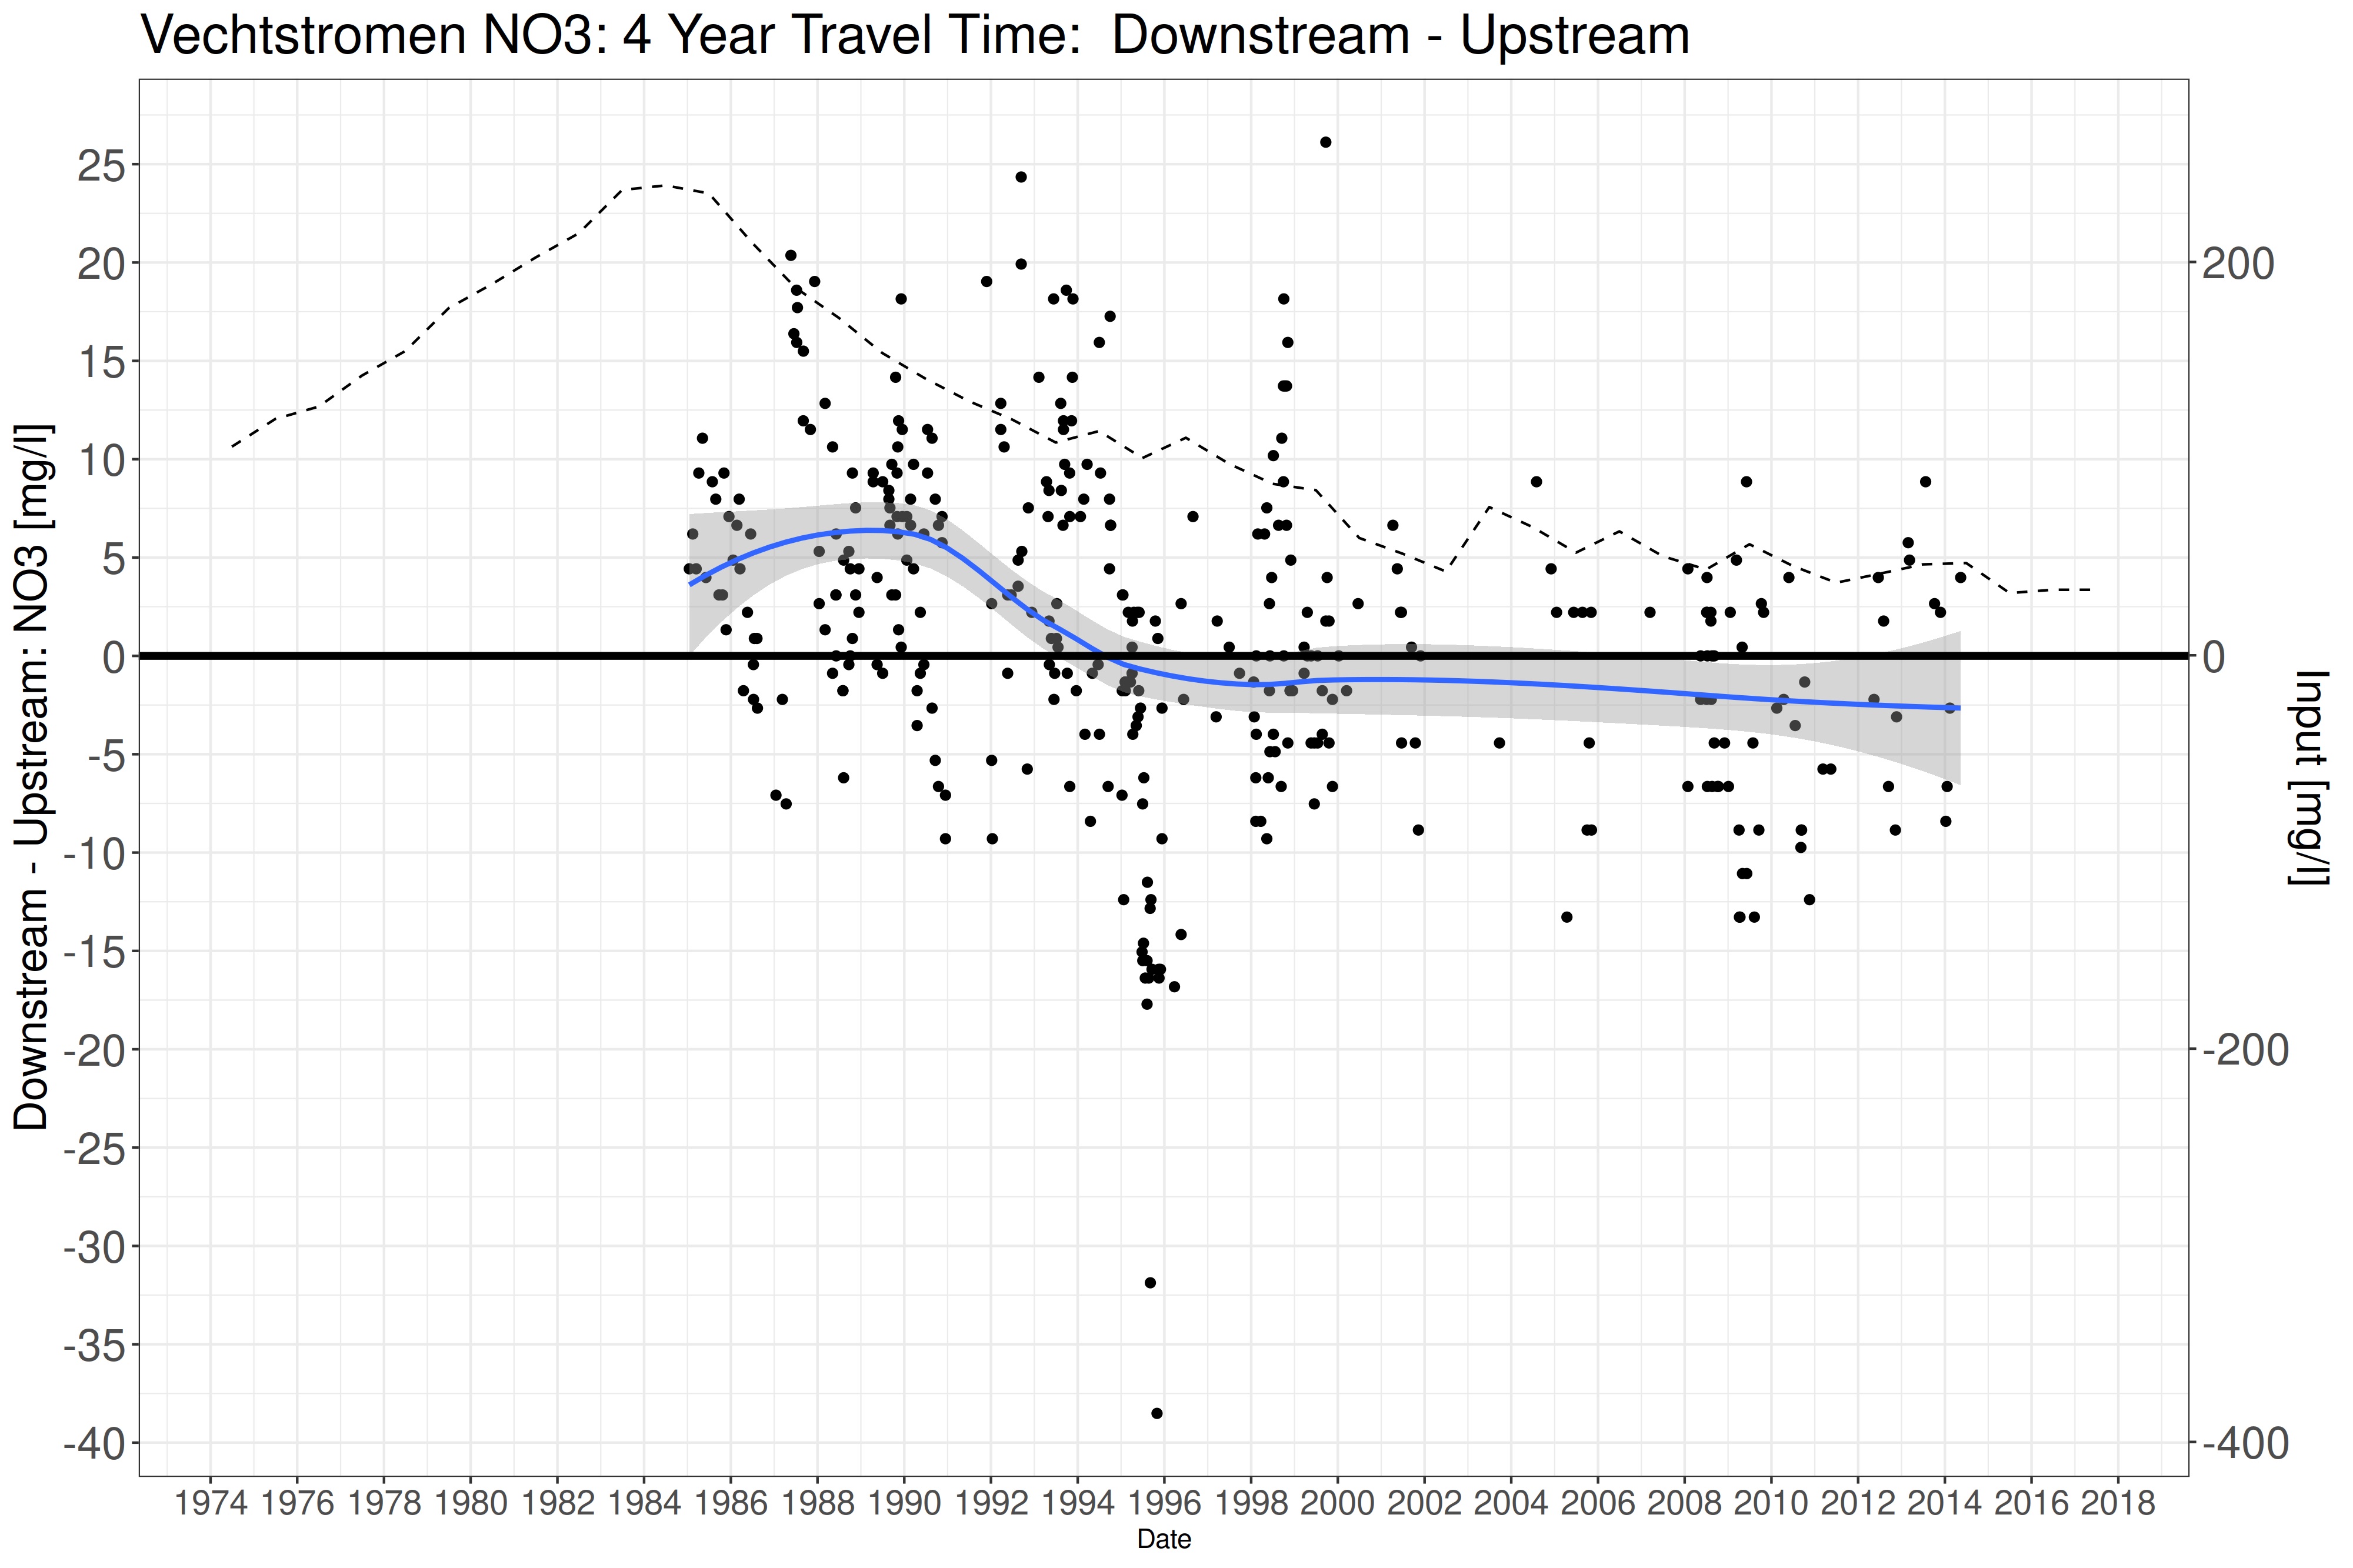
A loess smoother is over-plotted to give loose predictions of values for times when measurements were not taken. The gray band is the 95% uncertainty bound for the mean prediction [and not the prediction of the actual values, just the average value; that band would be four times larger, more or less]. The dashed line are the inputs of NO3 from Kaandorp [estimated to come from whatever sources that author said]. There is little correlation between the input and 4-year NO3 differences. There is also no steady signal of the differences in time, except that since about 2000 the variability is measurements is lower than previously.
Same thing happens at 0 and 11 years (indeed, if it’s 11 years, environmentalists everywhere would rejoice! There is much more nitrate up than downstream. But the farms are downstream. The farms are not causing any “crisis”. What a cause for celebration!
Right?
Right? Sigh.
Our conclusion:
[T]hose causes which remove NO3…from the environment are more important, and stronger, than those that add these chemicals. This has been so from about the mid to late 1990s. Assuming, as Kaandorp do, that agricultural fields add more nitrate than subtract it, there must then necessarily be other very important sources than agriculture, as yet unrecognized, that are removing nitrate, since there is less at the end than the beginning. Or it could be that the contributions of nitrate from agriculture are less than thought.
There is no “crisis.”
So why is the Netherlands government acting like there is?